
Appendix #9: Population, Houses, Households circa 1700
(Click here for links to 1695 spreadsheets or 1703 spreadsheets)
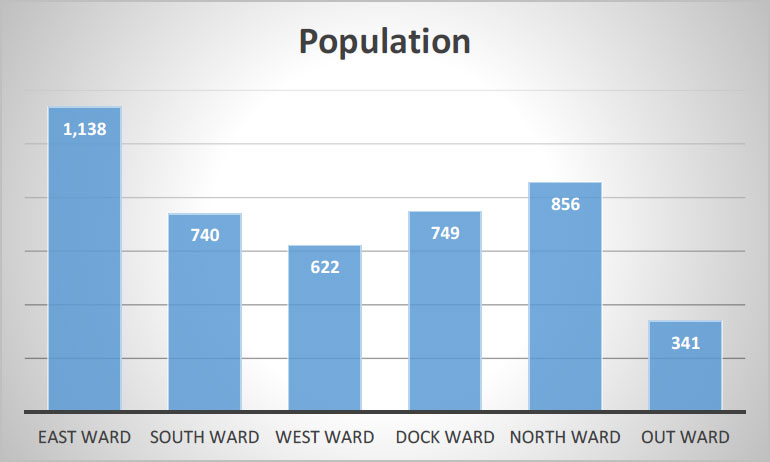
Illustration 9: Population of New-York circa 1700 by Ward
Table 1: Summary of Tax List for the Year 1695
Summary of data as developed in 1695 Spreadsheets 1-3 and from Tax List of 1695 in Collections of The New-York Historical Society for the year 1910 (New York: Printed for the Society MDCCCCXI)
| 1695 | Houses | Assessments | Total # of Assessments |
| East Ward | 95 | 50 | 145 |
| South Ward | 52 | 160 | 212 |
| West Ward | 106 | 57 | 163 |
| Dock Ward | 110 | 35 | 145 |
| North Ward | 120 | 50 | 170 |
| Total Sans Out Ward | 483 | 352 | 835 |
Table 2: Summary of Census of 1703 (sans Out Ward)
Summary of data as developed in 1703 Spreadsheets 4-6 and from THE DOCUMENTARY HISTORY OF THE STATE OF NEW YORK BY E. B. O'CALLAGHAN, M. D. Volume I. (Albany: Weed, Parsons, & Co. Public Printers 1850) pages 395 to 405 Census of the City of New-York about the year 1703
| 1703 | People | Households | People Per Household |
| East Ward | 1,138 | 213 | 5.3 |
| South Ward | 740 | 118 | 6.3 |
| West Ward | 622 | 130 | 4.8 |
| Dock Ward | 749 | 124 | 6.0 |
| North Ward | 856 | 181 | 4.7 |
| Total | 4,105 | 766 | 5.4 |
Table 3A: Summary of 1695 Tax List
| 1695 | Assessed Houses/Mills | Assessed Estates Without Houses | Total Tax Assessments |
| East Ward | 95 | 50 | 145 |
| South Ward | 52 | 160 | 212 |
| West Ward | 106 | 57 | 163 |
| Dock Ward | 110 | 35 | 145 |
| North Ward | 120 | 50 | 170 |
| Total | 483 | 352 | 835 |
| South Ward +40 | 92 | 120 | 212 |
| Total with +40 | 523 |
Table 3B: Summary 1703 Census
| 1703 | People | Households | People Per Household | Households Per House | People Per House |
| East Ward | 1138 | 213 | 5.3 | 2.2 | 12.0 |
| South Ward | 740 | 118 | 6.3 | 2.3 | 14.2 |
| West Ward | 622 | 130 | 4.8 | 1.2 | 5.9 |
| Dock Ward | 749 | 124 | 6.0 | 1.1 | 6.8 |
| North Ward | 856 | 181 | 4.7 | 1.5 | 7.1 |
| Total | 4105 | 766 | 5.4 | 1.6 | 8.5 |
| South Ward +40 | 740 | 118 | 6.3 | 1.3 | 8.0 |
| Total with +40 | 1.5 | 7.8 |
Note 1: The number of houses in South Ward seems artificially low. The analysis above based on a closer look at the census data (see South Ward Analysis Spreadsheet) suggests some listings as business were not only businesses but also houses/households. In the South Ward Analysis, the number of house/business combinations under plausible assumptions was between 40 and 60. Thus the addition of those to the calculation above slightly modifies Households/House and People/House as shown in the "South Ward + 40" and "South Ward + 60". Another analysis comparing Tax Listings from 1695 to the 1703 Census of households shows that at least 33 listings from 1695 have no indication as being used as a "house" but show up as a "household" in 1703. That does not include 35 1695 listings that would be "possible houses" under the plausible assumptions above. Plausible = listings over 50 pounds.
Note 2: For the purposes of these calculations the number of houses in 1695 is assumed to be the same as the number of houses in 1703. Although the population increased through 1700, a yellow fever epidemic reduced the population by 1703 to ten per cent less than 1698.
Discussion of Tables
Five of the six wards in The Tax List of 1695 itemized the assessments by real estate (house) and by personal estate. The Out Ward did not follow that convention and, in any case, is not shown in Illustration 6 (hence the compilations here without the inclusion of the Out Ward). The Tax List listed individual houses and the owner. It also listed people who were assessed for personal property in the house but had no liability for the house itself. Table 1 proceeds from the calculations from Spreadsheet 1 which lists the individual assessments by person and by ward.
Table 1... there seems to be some anomaly in the South Ward. The South Ward has more assessments than any other ward but has by this account only about half the houses of an average ward. One explanation could be that in that ward many people lived in the same buildings as their business. Instead of segregating the business from the house, the assessors simply assessed the business and included the building as part of the business' assets.
A closer analysis of the ward's assessments in 1703 Spreadsheets as shown in Table 3 calculates the possible assessments that might have included the house where people lived as being part of the business. From that analysis and the number of households in the South Ward, it is a reasonable assumption that perhaps 40 to 60 more assessments could be categorized as "houses". Taking the lower figure gives the figure of houses per ward circa 1700 as: East... 95; South... 92; West... 106; Dock... 110; North... 120. (See 1695 Spreadsheets and 1703 Spreadsheets).
1703 Spreadsheets shows Summaries of the Transcriptions with a total population 0f 4,446. That total for 1703 varies from other sources... Franklin Hough, CENSUS OF THE STATE OF NEW-YORK, FOR 1855 (Albany: Charles Van Benthuysen, 1858) page iv. The Table on that page for 1703 shows 4,375 but shows no contribution from the "over 60" category. In the listing of Transcription of 1703 in Appendix 7, the "Over 60" category shows 56 people. If these were added to the table the population would be 4,431, closer to the Appendix 7 Summary.
In the annotation on page iv (**) another source is listed, a 1712 letter to the Lords of Trade, which put the population at 4,436, even closer to the Appendix 7 count. Appendix 7 shows the population as 4,446 from O'Callaghan Documentary History of the State of New York (Albany: Weed, Parsons & Co 1850) Vol 1 pages 395-420.
Assuming that the "Transcription of 1703" Spreadsheet is accurate, a plausible explanation for many of these variances could be in the interpretation of the source documents. There is a note on several of the pages in O'Callaghan, mostly from the Out ward, that described them as illegible or otherwise incomplete. The listings with "?" could make a difference of 50 to 60 depending upon how those were counted. The methodology of Appendix 7 was to include the listing in the count if each demographic category was explicitly tabulated, irrespective of whether or not the household designation was legible.
Note: The total of the Transcription of 1703 is consistent with A Century of Population Growth (Washington: Government Printing Office 1909) page 170, which transcribes the same list as Transcription of 1703 (from O'Callaghan) and has the same overall result of 4,446. However, the Hough transcription made entry errors for Elener Eleworth in the East Ward. They recorded one too many "Female Children" and too few "Male Negros". Otherwise the counts are consistent.